Performance Tracker Calculator
How Much Can You Improve?
Based on your current performance and analysis tools, estimate your potential improvement. The article shows how tools like wearables and video analysis can increase performance by 15-30%.
Enter values to see your potential improvement.
Ever wonder how coaches know exactly when a soccer player slows down in the second half, or why a tennis pro changes their serve angle after just three matches? It’s not guesswork. It’s data. And that data comes from a growing list of tools designed to measure, track, and improve athletic performance. Sports analysis isn’t just for pros anymore. From high school teams to weekend warriors, the gear used to break down movement, effort, and strategy has become more accessible-and more powerful-than ever.
Wearable Sensors: The Body’s Digital Diary
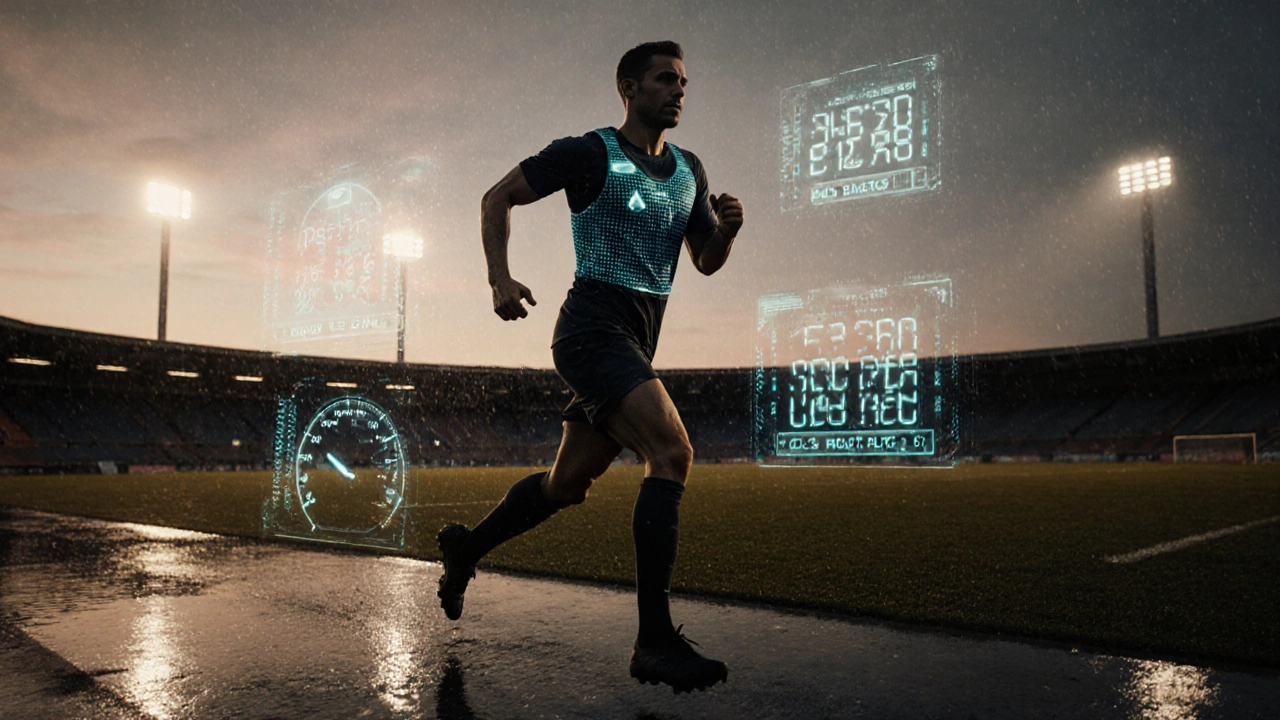
Wearable sensors are the backbone of modern sports analysis. These small, lightweight devices stick to the skin, clip onto jerseys, or fit inside shoes and measure everything from heart rate to acceleration. The most common types include GPS trackers, accelerometers, and gyroscopes. Brands like Catapult Sports and STATSports embed these into vests worn during training and games. They capture real-time data on distance covered, top speed, number of sprints, and even the force of each foot strike.
In rugby, for example, coaches use these vests to monitor how much physical load each player absorbs during a match. If a forward hits 12 high-speed runs in the first half but only three in the second, that’s a red flag. It’s not just about fatigue-it’s about injury risk. A study from the Australian Institute of Sport found that players who exceeded 1,000 meters of high-intensity running in a single session were 3.5 times more likely to suffer a hamstring strain the next day. Wearables make those numbers visible before it’s too late.
Video Analysis Systems: Seeing What the Eye Misses
Cameras are still one of the most powerful tools in sports analysis. But today’s systems aren’t just recording games-they’re decoding them. High-speed cameras, often mounted on tripods or ceilings, capture footage at 120 to 240 frames per second. Software then tracks player movement, ball trajectory, and even subtle shifts in body posture.
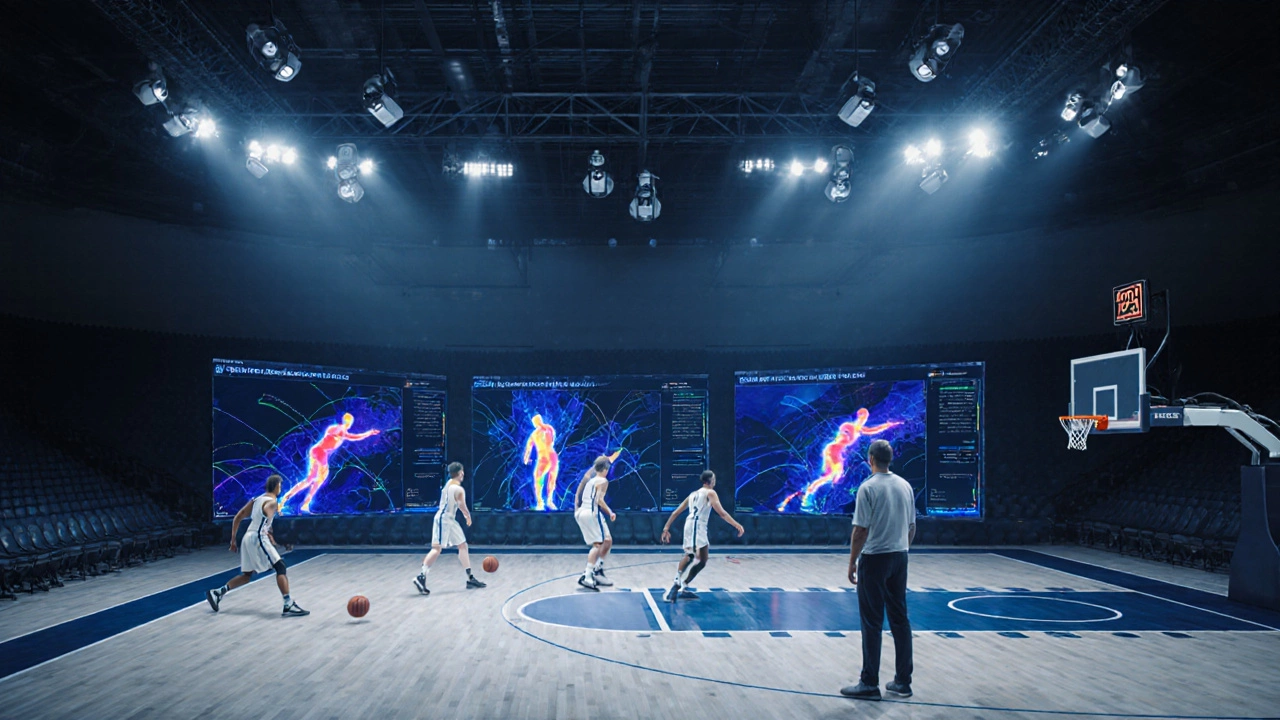
In basketball, teams use systems like Second Spectrum to map every player’s position on the court during each possession. They can see how often a guard drives left versus right, or how often a center gets screened on the pick-and-roll. Coaches then use this to adjust defensive schemes or design plays that exploit weaknesses. One NBA team reduced turnovers by 22% in one season just by identifying that their point guard was passing through traffic too early-something no one noticed watching the game live.
For swimming, underwater cameras paired with AI analysis track stroke length, kick frequency, and head position. Even a 2-degree tilt in the head during freestyle can increase drag by 8%. That’s the kind of detail these systems catch-and fix.
Force Plates and Motion Capture: Measuring the Invisible
Force plates are flat, instrumented surfaces installed in gyms and training facilities. When an athlete jumps, lands, or pushes off, the plate measures ground reaction forces-how hard and in what direction they’re pushing into the floor. This tells coaches whether an athlete is landing unevenly, favoring one leg, or losing power due to muscle fatigue.
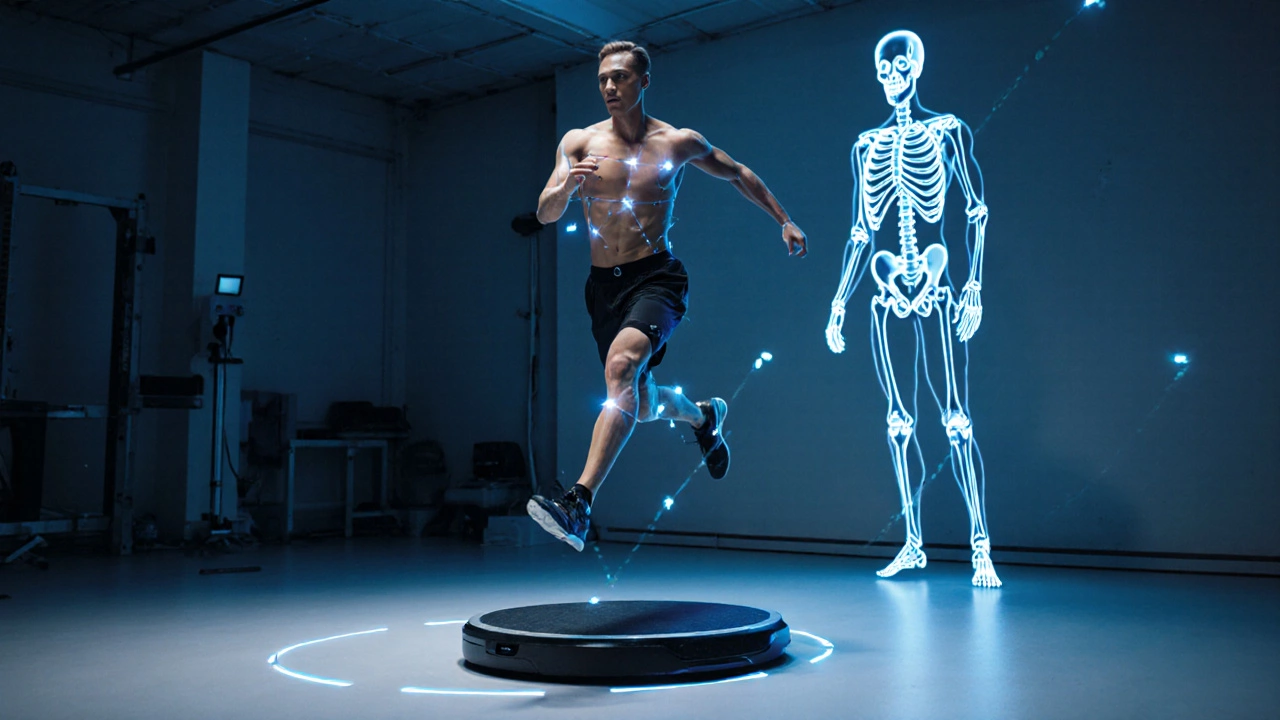
Combine force plates with motion capture systems like Vicon or OptiTrack, and you get a full 3D model of movement. Reflective markers are placed on key joints-knees, hips, shoulders-and cameras track their position in space. This is how Olympic sprinters fine-tune their start blocks. A 0.05-second improvement in block exit time can mean the difference between gold and fifth place. These systems show exactly which muscles fire when, and whether the timing is off by milliseconds.
One Australian athletics program used motion capture to fix a long jumper’s approach. The athlete was consistently overstriding, causing a braking effect. After adjusting foot placement based on the data, their jump distance increased by 18 centimeters in six weeks.
Heart Rate Monitors and Biometric Bands
Heart rate isn’t just about how hard someone is working-it’s about recovery, stress, and readiness. Modern heart rate monitors now measure not just beats per minute, but heart rate variability (HRV), which reflects how well the nervous system is recovering between sessions.
HRV drops when an athlete is overtrained or under-slept. A consistent dip over three days signals that the body needs rest, not more intensity. Teams like the Golden State Warriors use WHOOP bands to track HRV alongside sleep quality and strain levels. Their coaches adjust training loads daily based on this data. One player reduced his missed practices by 40% in a season simply by following HRV-guided recovery protocols.
Biometric bands also track skin temperature, respiration rate, and even hydration levels. These aren’t gimmicks-they’re early warning signs. A sudden rise in skin temperature during a training session can indicate inflammation before swelling even shows up.
Smart Equipment: The Gear That Talks Back
Some equipment is now built with sensors inside. Smart basketballs like the Spalding Smart Ball track bounce force, spin rate, and release angle. Smart soccer balls like the Adidas miCoach track speed, spin, and trajectory on every kick. Even smart tennis rackets, like the Babolat Play, record swing speed, impact location, and racket angle.
These tools turn practice into instant feedback loops. A tennis player hits 100 serves and gets a report showing that 72% of them landed in the T-zone-but with too much topspin. The next day, they adjust grip and swing path based on the data. No coach needed. Just the numbers.
For golf, launch monitors like TrackMan and FlightScope measure clubhead speed, ball speed, launch angle, and spin rate with laser precision. A 1-degree change in launch angle can add or subtract 15 yards off the tee. Golfers use this to pick the right driver for their swing-not just the one that looks cool.
Software and Dashboards: Turning Data Into Decisions
All this hardware means nothing without software to make sense of it. Platforms like Hudl, Kitman Labs, and DARTfish pull data from wearables, video, and smart gear into one dashboard. Coaches don’t need to be data scientists-they just need to see clear visuals: heat maps of player movement, graphs of workload trends, or side-by-side comparisons of technique.
A high school football team in Victoria started using Hudl last year. They noticed their linebackers were consistently arriving late to tackles because they were reading the play too slowly. After reviewing video clips side-by-side with elite players, they redesigned their defensive drills. In the next season, their tackle success rate jumped from 68% to 84%.
The best dashboards don’t just show data-they tell you what to do next. They flag anomalies, suggest drills, and even predict injury risk based on historical patterns.
What’s Missing? The Human Element
Technology gives you numbers. But it doesn’t tell you why an athlete is hesitant, or if they’re mentally drained. The best analysis teams combine data with observation. A coach might see that a player’s sprint speed dropped 12%-but only by talking to them do they learn the player’s parent was hospitalized last week.
Equipment doesn’t replace coaching. It empowers it. The most successful programs use tech to ask better questions, not to make decisions for them.
Where to Start?
You don’t need a $50,000 motion capture lab to begin. Start small:
- Use a GPS watch to track distance and pace during training.
- Record one drill per week on your phone and review it with a teammate.
- Try a heart rate monitor to see how your body responds to different workouts.
- Use free video analysis apps like Coach’s Eye or Dartfish Express to slow down footage and mark key moments.
Progress comes from consistency, not complexity. One club in Melbourne started using free smartphone apps to analyze their junior netball team’s footwork. Within six months, their passing accuracy improved by 30%. No expensive gear. Just attention to detail.
What’s Next?
The future of sports analysis is real-time AI. Imagine a headset that gives a soccer player audio feedback mid-game: "You’re drifting left. Shift weight to your right foot." Or a smart jersey that adjusts compression based on muscle fatigue. These aren’t sci-fi-they’re in testing right now.
But the core idea won’t change: better data leads to better decisions. Whether you’re a coach, athlete, or just someone who wants to train smarter, the right equipment turns effort into insight.